HOW QUANTBUILDER WORKS
Build AI-powered trading models, get daily stock picks, backtest strategies, and execute trades—all in one platform. No coding required.
🎯 WHAT IS QUANTBUILDER?
📊 For Quants
QuantBuilder is your AI research assistant. Train machine learning models on historical stock data, get daily picks ranked by confidence, and backtest strategies before risking real money.
- ✓ No coding knowledge required
- ✓ Visual interface for model building
- ✓ Daily predictions delivered automatically
- ✓ Connect broker for instant execution
🎬 THE 4-STEP WORKFLOW
1. BUILD
Train AI models on historical data
2. BACKTEST
Test strategy on historical data
3. ANALYZE
Review daily picks & confidence scores
4. EXECUTE
Connect broker & trade (optional)
🔨 STEP 1: BUILD AI MODELS
Create machine learning models that learn patterns from years of stock market data. No coding required—just choose your settings and click Train.
🎯 What You Choose:
- Stock Universe: QB500, QB1000, NASDAQ-100, or sector-specific
- Training Regime: Bull markets, bear markets, sideways, recessions, expansions
- Target: What return to predict (3-day +2%, 7-day +5%, etc.)
- Features: Select from over 450+ technical, fundamental & macro indicators
- Algorithm: LightGBM, XGBoost, CatBoost, Random Forest
- Backtest Length: Standard walk-forward validation period
⚡ What Happens:
- Training (5-15 mins): AI analyzes thousands of stocks across years
- Pattern Detection: Finds relationships between indicators & price moves
- Validation: Tests model on unseen data to prevent overfitting
- Scoring: Generates performance metrics (accuracy, Sharpe, etc.)
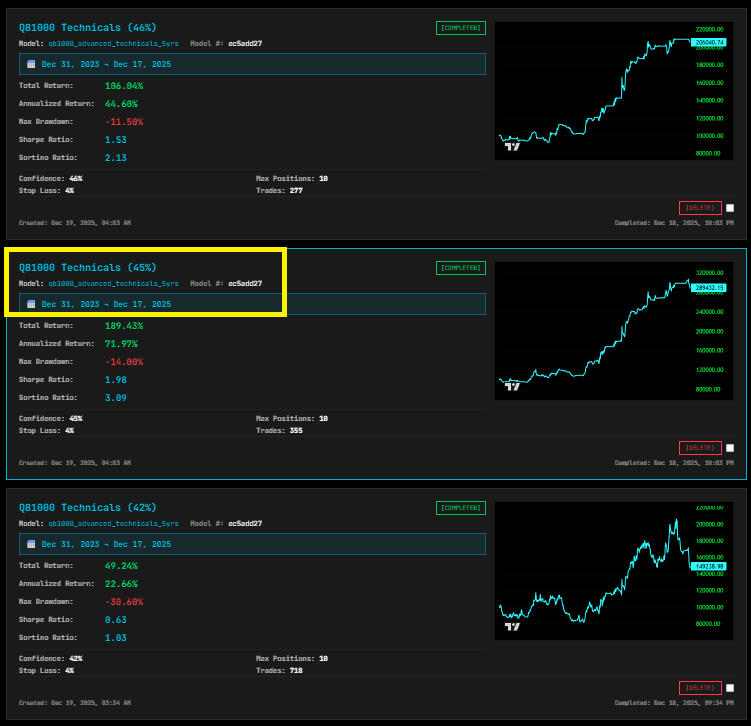
⚡ STEP 2: PORTFOLIO BACKTEST YOUR STRATEGY
Before risking real money, test your model's picks against historical data. See how a $10,000 portfolio would have performed over the past year.
📊 Real Backtest Results - Pick The Best One:
You'll test multiple strategies. Here are 3 variations with different confidence thresholds. Notice how 45% confidence is the winner (better than 46%, which is still solid) but 42% confidence drops off a cliff.
✅ POINT-IN-TIME COMPLIANT BACKTESTS
Our backtests use Point-in-Time (PIT) compliant data, which means:
- ✓ Real Delisting History: Includes bankruptcies, buyouts, and delisted companies—not just "survivors"
- ✓ Historical Accuracy: Uses data as it actually existed at each point in time (no look-ahead bias)
- ✓ Realistic Results: Your backtest sees the same messy reality traders faced in real-time
⚠️ Note: Backtests do not account for commissions or slippage. Real trading costs will reduce your actual returns.
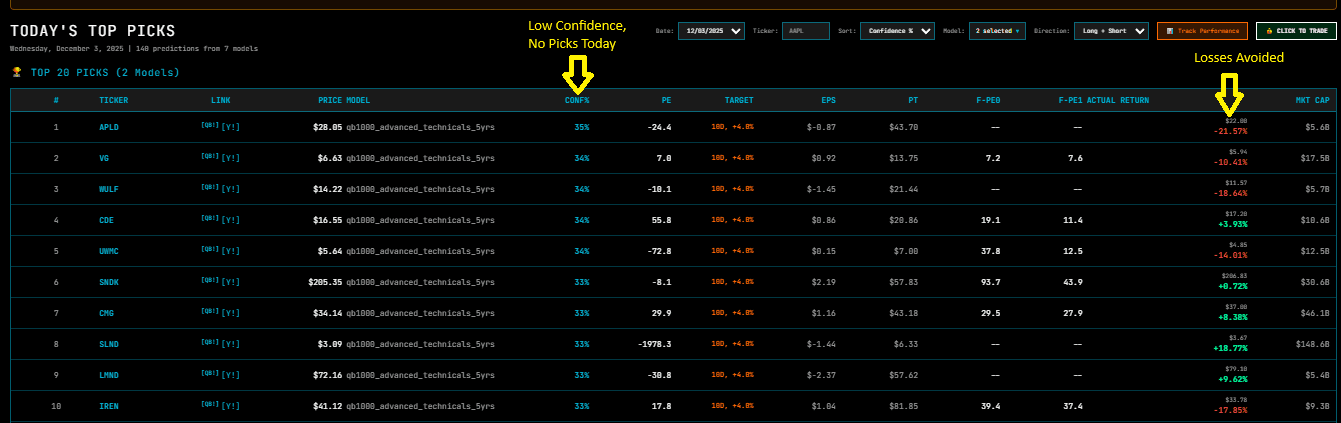
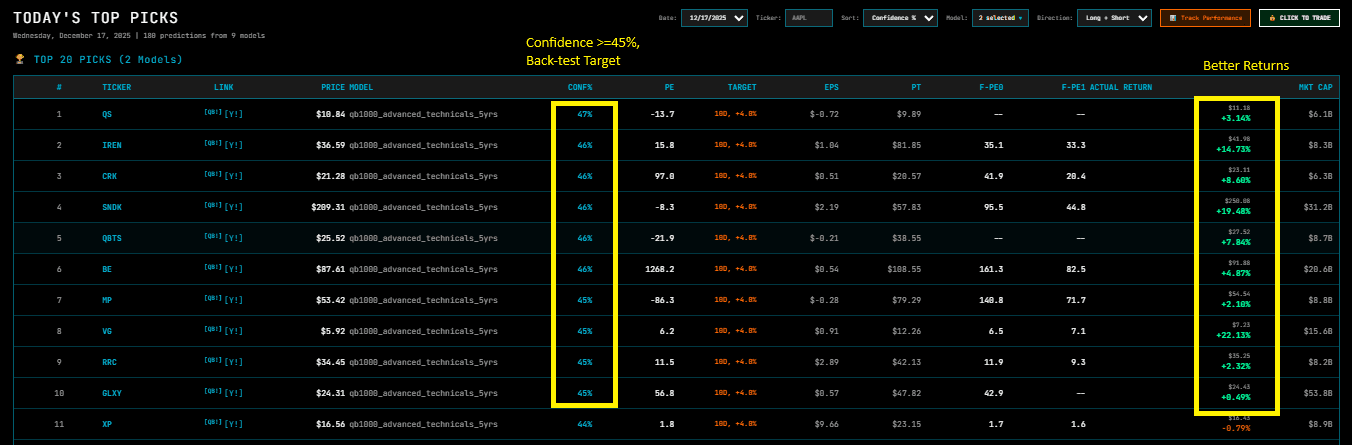
📈 STEP 3: TODAY'S PICKS
Every morning, your models analyze the current market and generate ranked predictions. Each pick shows confidence %, expected return, direction (long/short), and key metrics.
Low Confidence Day - Losses Avoided
When most picks fall below your confidence threshold (typically 45%), the system warns you NOT to trade. This day would have resulted in losses - see the red "Actual Return" column showing negative returns.
High Confidence Day - Better Returns
When picks hit 45%+ confidence, the model delivers strong signals. Check the green "Actual Return" column - multiple winners! This is when you want to be in the market.
🎯 Understanding Confidence
Confidence = how certain the model is. IMPORTANT:55% from Model A might be better than 90% from Model B. It's relative to each model's historical accuracy.
📊 Long vs Short
LONG: Expecting price to GO UP. Traditional "buy" trade.
SHORT: Expecting price to GO DOWN. Profit from decline (requires margin account).
💼 STEP 4: BROKER CONNECTIONS (OPTIONAL)
QuantBuilder currently integrates with Alpaca (additional brokers coming soon). Connect your API keys and use QuantBuilder's interface to transmit trade orders to your registered broker account with one click.
🔐 Security Features
- 4-Digit Trading PIN: Required before every trade
- Encrypted API Keys: Broker credentials stored securely
- Trading Waiver: One-time legal acknowledgment
- Paper Trading First: Test with fake money before going live
⚡ Trading Features
- Batch Trading: Send 10+ orders in one click
- Bracket Orders: Automatic take-profit & stop-loss
- Position Sizing: Equal dollar or manual quantities
- Long & Short: Profit from up or down moves
🚨 CRITICAL TRADING WARNINGS
- ⛔ QuantBuilder is a research platform. We do not execute trades. All orders are transmitted through your broker account.
- ⛔ Trading involves substantial risk, including the risk of permanent capital loss.
- ⛔ Paper trade FIRST. Test strategies with fake money before risking real capital.
- ⛔ Always use proper risk management.
- ⛔ Past performance ≠ future results. Models can be wrong. Markets change. Stay vigilant.
💡 EXAMPLE: Batch Trade Flow
🔍 RESEARCH TOOLS
Deep-dive into any stock with charts, technical indicators, financial statements, and analyst ratings. Validate your model's picks before trading.
📊 Technical Analysis
- • Interactive price charts (1D to 5Y timeframes)
- • RSI, MACD, Bollinger Bands overlays
- • Volume analysis
- • Support/resistance levels
- • Trend indicators
💼 Fundamental Data
- • Financial statements (Income, Balance Sheet, Cash Flow)
- • Key ratios (P/E, P/B, Debt/Equity, ROE)
- • Earnings estimates (FY0, FY1)
- • Analyst ratings & price targets
- • Company overview & sector info
READY TO BUILD YOUR EDGE?
Join traders using AI to find opportunities, backtest strategies, and execute with confidence.
No credit card required • 5 models free • Upgrade anytime
DISCLAIMER: QuantBuilder is a research platform providing tools for analysis. We do not provide financial advice, manage investments, or recommend specific trades. All trading decisions are YOUR responsibility. Trading involves substantial risk of loss. Past performance does not indicate future results. Consult a licensed financial advisor before making investment decisions.